
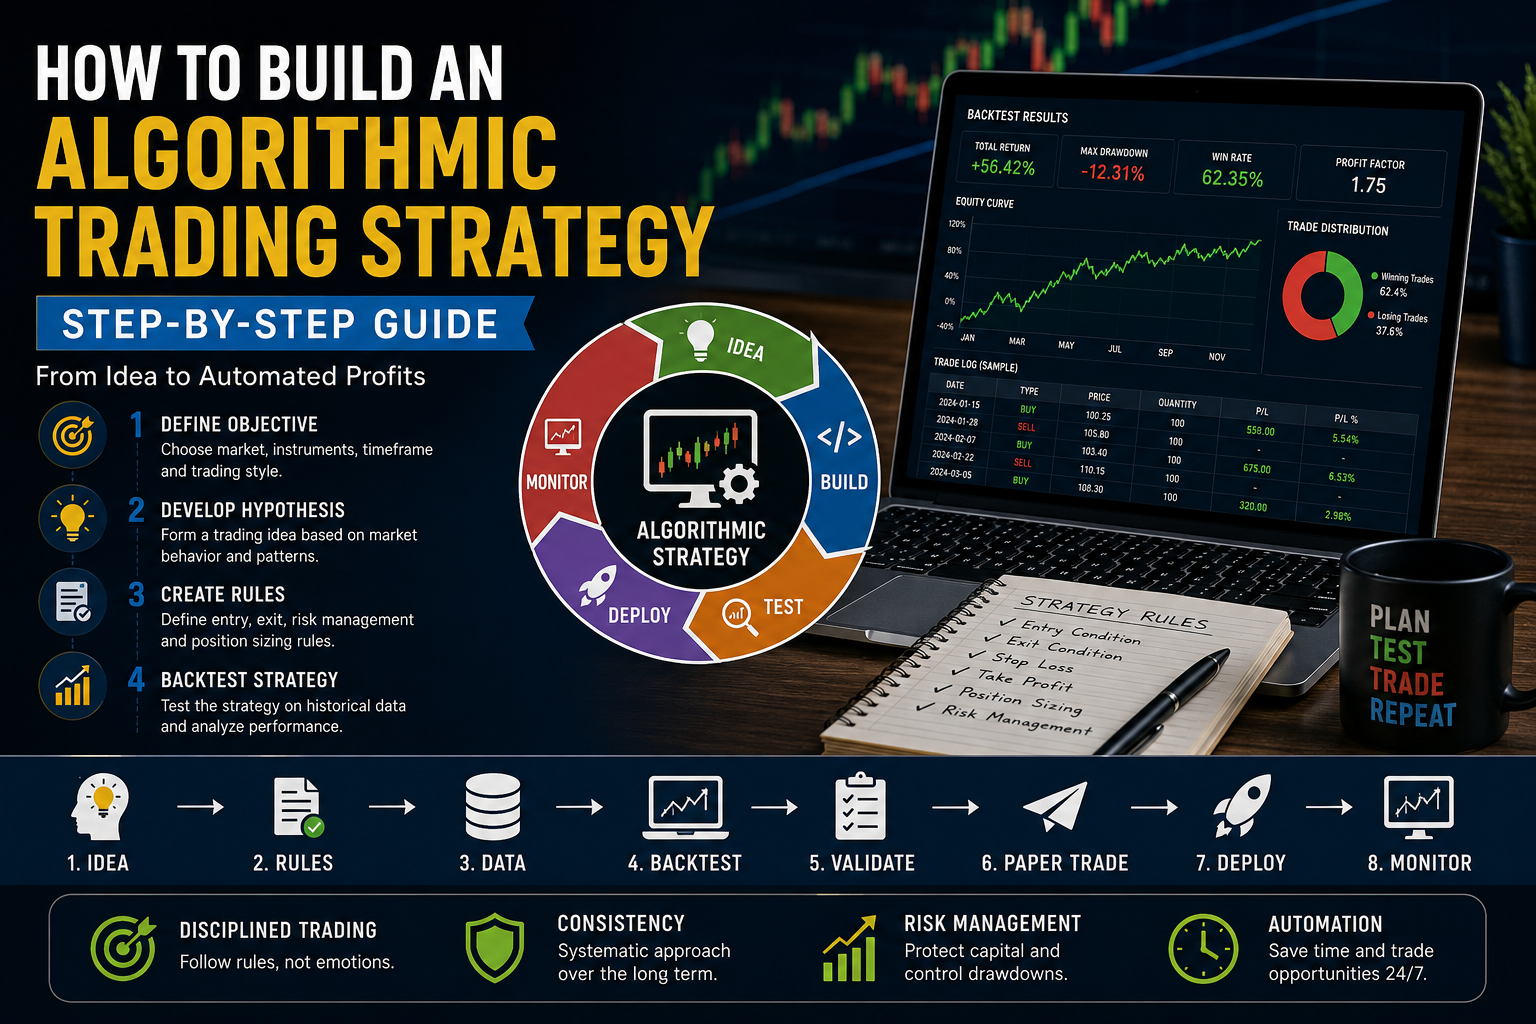
Algorithmic trading allows traders to use software and predefined rules to analyze markets and execute trades systematically. But before an algorithm can place trades, it needs a clearly defined trading strategy.
Building an algorithmic trading strategy is more than simply combining technical indicators. A robust strategy requires a clear trading idea, objective rules, historical testing, risk management, and continuous monitoring.
In this guide, we explain how to build an algorithmic trading strategy step by step.
What Is an Algorithmic Trading Strategy?
An algorithmic trading strategy is a set of predefined rules that determines when a trading system should enter, exit, or manage a position.
A strategy may use:
- Price data
- Technical indicators
- Trading volume
- Market trends
- Volatility
- Statistical relationships
- Fundamental data
- Time-based conditions
The key difference between a systematic strategy and discretionary trading is that the rules can be clearly defined and translated into instructions that software can execute.
Step 1: Define Your Trading Objective
Before writing any code, determine what you want the strategy to accomplish.
Consider questions such as:
- Which market do you want to trade?
- Which instruments will you trade?
- What timeframe will you use?
- How frequently will the strategy trade?
- What level of risk are you comfortable testing?
- Is the strategy trend-following, mean-reversion, momentum, or another approach?
A clear objective prevents the strategy from becoming a collection of unrelated rules.
Step 2: Choose a Trading Market
Different markets have different characteristics.
You could potentially develop strategies for:
- Stocks
- Futures
- Options
- Forex
- Commodities
- Index products
- Digital assets
The choice of market affects liquidity, trading hours, transaction costs, volatility, and available trading infrastructure.
A strategy designed for one market may not work equally well in another.
Step 3: Develop a Trading Hypothesis
A strong strategy starts with a hypothesis.
A hypothesis is an idea about why a particular market behavior might create a potential trading opportunity.
For example:
When an asset experiences a strong momentum move accompanied by increasing volume, the price may continue moving in the same direction for a certain period.
The hypothesis can then be converted into measurable rules.
The objective is to test the idea rather than assume that it is profitable.
Step 4: Convert the Idea Into Rules
The next step is turning the hypothesis into objective conditions.
For example, a simple trend-following strategy might use:
Entry Rule
Buy when the 20-period moving average crosses above the 50-period moving average.
Exit Rule
Exit when the 20-period moving average crosses below the 50-period moving average.
Risk Rule
Limit the amount of capital exposed to each position.
The rules should be specific enough that two different developers would implement them in essentially the same way.
Avoid vague instructions such as:
Buy when the market looks strong.
Instead, define exactly what “strong” means using measurable conditions.
Step 5: Select Indicators Carefully
Indicators can help quantify market conditions, but adding more indicators does not automatically make a strategy better.
Common indicators include:
- Moving averages
- RSI
- MACD
- Bollinger Bands
- ATR
- ADX
- Volume indicators
Start with a simple strategy and add complexity only when there is a clear reason to do so.
Using too many indicators can make a strategy difficult to understand and increase the risk of overfitting.
Step 6: Define Entry Conditions
Entry conditions determine when the algorithm opens a position.
A strategy may require one condition or several conditions to be satisfied.
For example:
Buy when:
- The short-term moving average is above the long-term moving average.
- RSI is above a predefined threshold.
- Trading volume is above its recent average.
- The market is within the permitted trading session.
The algorithm checks these conditions automatically.
Step 7: Define Exit Conditions
Knowing when to exit is just as important as knowing when to enter.
Exit rules may include:
- Stop-loss
- Take-profit
- Trailing stop
- Indicator reversal
- Time-based exit
- Volatility-based exit
- Maximum holding period
A strategy should clearly define what happens when a position moves against the expected direction.
Step 8: Add Position Sizing
Position sizing determines how much capital is allocated to each trade.
A strategy may use:
- Fixed quantity
- Fixed capital allocation
- Volatility-based sizing
- Risk-based sizing
- Portfolio-based allocation
For example, a system could calculate position size based on the distance between the entry price and stop-loss.
Position sizing is an important part of risk management because the same strategy can have very different risk characteristics depending on how much capital is allocated to each trade.
Step 9: Build Risk Management Rules
Risk management should be part of the strategy from the beginning.
Possible rules include:
- Maximum risk per trade
- Maximum daily loss
- Maximum number of open positions
- Maximum portfolio exposure
- Maximum drawdown threshold
- Stop-loss requirements
- Trading suspension after unusual losses
Risk controls can help prevent a single strategy failure from causing disproportionate damage to a trading account.
Step 10: Collect Quality Historical Data
Once the strategy rules are defined, you need appropriate historical data for testing.
Depending on the strategy, you may need:
- OHLC price data
- Volume
- Bid and ask prices
- Corporate actions
- Futures contract information
- Market-specific data
Data quality matters because errors or missing information can distort backtesting results.
Step 11: Backtest the Strategy
Now the strategy can be tested against historical data.
The backtesting engine applies the rules chronologically and simulates trades.
Important metrics to analyze include:
- Total return
- Maximum drawdown
- Win rate
- Profit factor
- Number of trades
- Average trade
- Risk-adjusted returns
- Transaction costs
Do not focus only on the final return.
A strategy with a high historical return and an extremely large drawdown may have a very different risk profile from a strategy with a lower return and smaller drawdown.
Step 12: Avoid Overfitting
One of the biggest challenges in strategy development is overfitting.
Overfitting occurs when a strategy is excessively optimized for historical data and loses its effectiveness on unseen data.
For example, repeatedly adjusting indicator parameters until historical performance becomes exceptionally high may produce a strategy that looks impressive in a backtest but performs poorly in live markets.
Keep the strategy as simple as reasonably possible and test it on data that was not used during development.
Step 13: Perform Out-of-Sample Testing
Separate historical data into development and validation periods.
Use the development data to build the strategy and the unseen data to evaluate it.
If the strategy performs reasonably well across both datasets, it provides stronger evidence that the results may not simply be caused by fitting historical noise.
Step 14: Use Walk-Forward Analysis
Walk-forward analysis can provide another layer of testing.
A simplified process looks like:
Training Data → Strategy Optimization → Unseen Testing Data → Move Forward → Repeat
This allows developers to examine how the strategy behaves when market conditions change over time.
Step 15: Paper Trade the Strategy
After historical testing, consider running the strategy in a simulated environment.
Paper trading can help identify practical problems involving:
- Market data
- API connectivity
- Order handling
- Execution timing
- Position tracking
- Risk controls
- Software failures
This step can be particularly useful before deploying a strategy with real capital.
Step 16: Build the Trading System
Once the strategy has been thoroughly tested, it can be connected to a live trading environment.
A typical algorithmic trading architecture may include:
Market Data → Strategy Engine → Risk Management → Order Management → Broker API → Monitoring
Additional components may include databases, logging systems, dashboards, alerting systems, and backup infrastructure.
Technologies Used to Build Algorithmic Trading Strategies
Different technologies can be used depending on the requirements.
Python
Python is widely used for:
- Strategy development
- Data analysis
- Backtesting
- Machine learning
- Prototyping
C++
C++ can be useful when very low latency and high-performance execution are important.
Java
Java is widely used in financial software and can be suitable for large-scale trading infrastructure.
SQL
SQL is useful for storing and analyzing:
- Market data
- Trade history
- Orders
- Performance records
Trading APIs
Broker and exchange APIs allow trading systems to retrieve data and submit orders programmatically.
Example of a Simple Algorithmic Strategy
Consider a basic moving-average strategy.
Rules
Entry:
- Buy when the 20-day moving average crosses above the 50-day moving average.
Exit:
- Sell when the 20-day moving average crosses below the 50-day moving average.
Risk management:
- Apply a predefined stop-loss.
- Limit position size.
- Stop trading after a predefined daily loss.
The strategy can then be backtested using historical data and evaluated using multiple performance and risk metrics.
This is only a simple example. Real-world strategy development requires much more extensive validation.
Common Mistakes When Building Algorithmic Strategies
Starting With Code Instead of a Hypothesis
Writing code before defining the trading idea can lead to unnecessary complexity.
Using Too Many Indicators
More indicators do not necessarily produce better signals.
Ignoring Transaction Costs
Brokerage, spreads, taxes, and slippage can significantly affect actual performance.
Overfitting Historical Data
A strategy that is too optimized for the past may not generalize to future market conditions.
Ignoring Risk Management
A profitable strategy can still experience substantial losses without proper position sizing and risk controls.
Testing Only One Market Environment
A strategy should be evaluated across different market conditions where practical.
Deploying Immediately After Backtesting
Historical testing alone is not enough. Paper trading and controlled deployment can provide additional information about real-world execution.
How Long Does It Take to Build an Algorithmic Trading Strategy?
There is no fixed timeline.
A simple strategy prototype can potentially be developed quickly, while a robust production-grade system may require considerably more time.
The development process can involve:
- Research
- Strategy design
- Data preparation
- Programming
- Backtesting
- Optimization
- Validation
- Paper trading
- Deployment
- Monitoring
The more complex the strategy and infrastructure, the greater the development and testing requirements.
Final Thoughts
Building an algorithmic trading strategy is a process of turning a trading hypothesis into objective, testable rules.
The basic workflow is:
Research → Hypothesis → Rules → Data → Backtesting → Validation → Paper Trading → Controlled Deployment → Monitoring
The most important principle is to focus on robustness rather than impressive historical returns.
A strategy should be understandable, realistically tested, properly risk-managed, and evaluated on data that was not used to develop it.
Algorithmic trading can provide powerful automation, but successful automation starts with a well-designed trading process—not simply with code.
Frequently Asked Questions
Can beginners build an algorithmic trading strategy?
Yes. Beginners can start with simple rule-based strategies while learning trading, programming, data analysis, and risk management.
Do I need programming knowledge?
Programming is useful for building a customized algorithmic trading system. However, some platforms provide low-code or visual strategy-building tools.
Is algorithmic trading profitable?
It can be, but profitability is not guaranteed. Market conditions, strategy quality, execution costs, risk management, and many other factors affect results.
What is the first step in building an algorithmic strategy?
The first step is defining a clear trading hypothesis and converting it into objective, measurable rules.
How do I know if my strategy is overfitted?
Testing the strategy on unseen data, using walk-forward analysis, limiting unnecessary parameters, and checking robustness across different market conditions can help identify potential overfitting.
Should I use real money immediately after backtesting?
Generally, historical backtesting alone should not be treated as sufficient evidence for immediate full-scale deployment. Paper trading and carefully controlled live testing can provide additional validation.
What is the most important part of an algorithmic trading strategy?
There is no single component that guarantees success. A strong strategy combines a sensible trading hypothesis, robust testing, realistic execution assumptions, and disciplined risk management.