
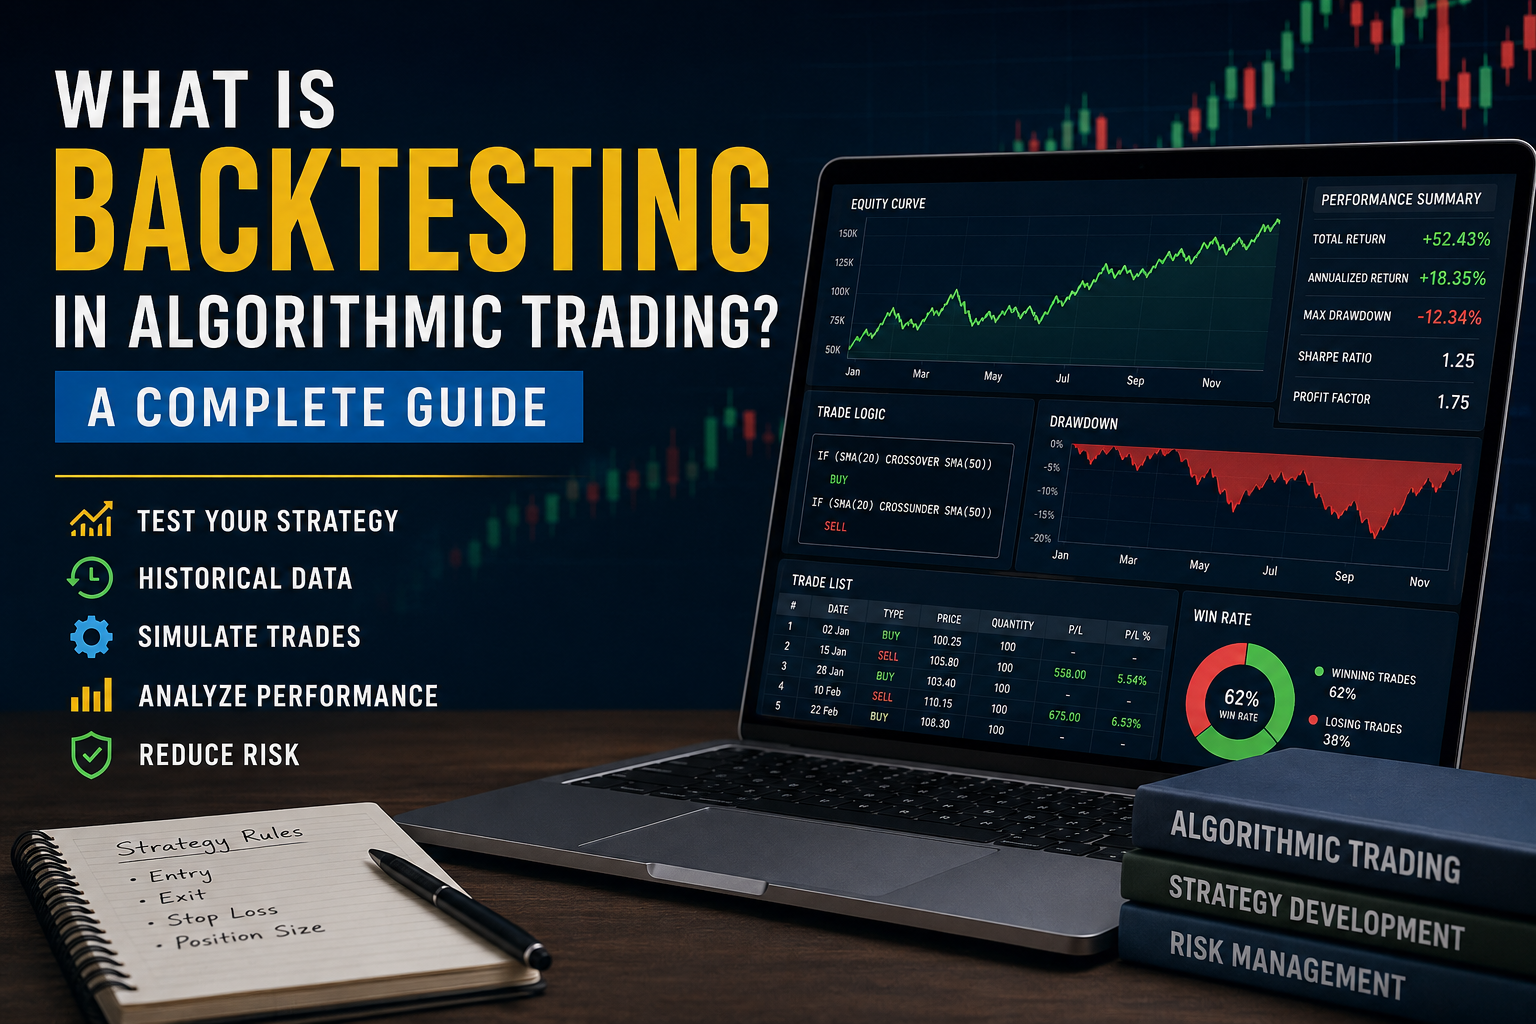
Before deploying an algorithmic trading strategy with real money, traders need to understand how the strategy might have performed under historical market conditions. Backtesting is one of the most important processes used for this purpose.
Backtesting allows traders and developers to apply a trading strategy to historical market data and analyze its hypothetical performance.
But how does backtesting work? What metrics should you analyze? And can a successful backtest guarantee future profits?
Let's explore everything you need to know about backtesting in algorithmic trading.
What Is Backtesting?
Backtesting is the process of testing a trading strategy against historical market data to evaluate how it would have performed in the past.
For example, imagine you create a strategy with these rules:
- Buy when the 20-day moving average crosses above the 50-day moving average.
- Sell when the 20-day moving average crosses below the 50-day moving average.
- Use a predefined stop-loss.
- Risk only a specific portion of the trading capital on each trade.
A backtesting system can apply these rules to historical data and calculate the hypothetical trades and performance.
The goal is not to prove that the strategy will make money in the future. Instead, backtesting helps determine whether the strategy has characteristics worth investigating further.
Why Is Backtesting Important?
Developing a trading strategy without testing it can be similar to launching a product without checking whether it works.
Backtesting provides valuable information about how a strategy behaved under different historical market conditions.
It can help identify:
- Potential profitability
- Maximum drawdown
- Win rate
- Number of trades
- Average trade performance
- Risk-to-reward characteristics
- Performance during different market conditions
- Potential weaknesses in the strategy
It can also help traders compare different versions of the same strategy.
How Does Algorithmic Trading Backtesting Work?
A typical backtesting process looks like this:
Trading Strategy → Historical Data → Simulation → Trade Generation → Performance Analysis
Step 1: Define the Strategy
First, the strategy needs clearly defined rules.
These rules should specify:
- Entry conditions
- Exit conditions
- Position sizing
- Stop-loss rules
- Take-profit rules
- Trading hours
- Maximum exposure
The more precisely the rules are defined, the easier they are to test.
Step 2: Collect Historical Data
The strategy is then tested using historical market data.
Depending on the strategy, data may include:
- Open price
- High price
- Low price
- Close price
- Trading volume
- Bid and ask prices
- Corporate actions
- Market-specific information
The quality of this data can significantly affect the reliability of the backtest.
Step 3: Run the Simulation
The backtesting engine processes the historical data chronologically.
It applies the strategy's rules and determines when hypothetical trades would have occurred.
For example:
Market condition → Buy signal → Simulated order → Position opened → Exit condition → Position closed
The process is repeated across the selected historical period.
Step 4: Include Trading Costs
A realistic backtest should account for costs.
These may include:
- Brokerage fees
- Exchange fees
- Taxes
- Slippage
- Bid-ask spread
- Other transaction costs
Ignoring these costs can make a strategy appear more profitable than it might actually be.
Step 5: Analyze the Results
After the simulation is complete, traders can analyze the resulting performance.
Common metrics include:
- Net return
- Annualized return
- Maximum drawdown
- Win rate
- Profit factor
- Sharpe ratio
- Number of trades
- Average profit/loss per trade
Important Backtesting Metrics
Understanding performance metrics is critical.
1. Total Return
Total return shows how much the strategy gained or lost over the testing period.
However, return should never be analyzed by itself.
A strategy generating high returns while taking extreme risk may be less attractive than a strategy producing lower returns with significantly lower drawdown.
2. Maximum Drawdown
Maximum drawdown measures the largest peak-to-trough decline in the strategy's simulated equity.
For example, if an account grows from ₹10 lakh to ₹15 lakh and later falls to ₹12 lakh, the drawdown from that peak is ₹3 lakh, or 20%.
Drawdown is one of the most important risk metrics in strategy evaluation.
3. Win Rate
Win rate represents the percentage of trades that were profitable.
For example:
60 winning trades ÷ 100 total trades = 60% win rate
A high win rate does not automatically mean a strategy is profitable.
A strategy can have a high win rate but still lose money if its losing trades are much larger than its winning trades.
4. Profit Factor
Profit factor compares gross profits with gross losses.
A simplified formula is:
Profit Factor = Gross Profit ÷ Gross Loss
A value above 1 indicates that gross profits exceeded gross losses during the tested period.
5. Sharpe Ratio
The Sharpe ratio is commonly used to evaluate risk-adjusted performance.
It provides a way to compare returns relative to the variability of those returns.
However, it should not be used as the only measure of strategy quality.
6. Number of Trades
The number of trades is also important.
A strategy that generated a very high return from only a handful of trades may require more investigation than a strategy tested across hundreds or thousands of trades.
The appropriate sample size depends heavily on the strategy and timeframe.
What Is Overfitting in Backtesting?
One of the biggest dangers in algorithmic trading is overfitting.
Overfitting occurs when a strategy is excessively optimized for historical data and ends up capturing patterns that may not persist in the future.
For example, a developer might continuously change:
- Indicator periods
- Entry thresholds
- Stop-loss levels
- Take-profit levels
- Trading hours
until the historical results look extremely impressive.
The problem is that the strategy may have learned the historical data rather than discovering a robust trading relationship.
What Is Data Snooping?
Data snooping occurs when historical data is repeatedly examined or manipulated to find patterns that appear profitable by chance.
If enough combinations are tested, some strategies will inevitably look successful simply because of randomness.
This is why robust strategy development requires careful separation between development data and unseen data.
In-Sample vs Out-of-Sample Testing
A common approach is to divide historical data into different sections.
In-Sample Data
This data is used to develop and optimize the strategy.
Out-of-Sample Data
This data is kept separate and used to evaluate whether the strategy performs on information it has not been optimized against.
A strategy that performs well on both datasets may provide more confidence than one that only performs well on its development data.
What Is Walk-Forward Testing?
Walk-forward testing takes the concept further.
Instead of optimizing a strategy once and testing it on one fixed period, the strategy is repeatedly developed and evaluated across rolling periods.
For example:
Training Period → Testing Period → Move Forward → Training Period → Testing Period
This can provide a more realistic evaluation of how a strategy might adapt to changing market conditions.
Backtesting vs Paper Trading
Backtesting and paper trading are related but different.
FeatureBacktestingPaper TradingDataHistoricalLive or near-liveReal moneyNoNoHistorical evaluationYesLimitedLive execution testingNoYesAPI testingLimitedYesSlippage realismDepends on modelUsually more realisticStrategy developmentVery usefulUseful after backtesting
A common workflow is:
Backtesting → Paper Trading → Small-Scale Live Testing → Full Deployment
The exact process depends on the strategy and risk tolerance.
Common Backtesting Mistakes
Ignoring Transaction Costs
A strategy may look profitable before costs but become unprofitable after brokerage, spread, taxes, and slippage.
Using Future Information
A backtest must never use information that would not have been available at the exact time of a simulated trade.
This is commonly known as look-ahead bias.
Over-Optimizing Parameters
Optimizing too many parameters can make a strategy fragile.
Using Poor-Quality Data
Incorrect or incomplete historical data can produce misleading results.
Ignoring Liquidity
A backtest may assume that an order can be executed at a particular price even when the real market would not have sufficient liquidity.
Testing Only One Market Condition
A strategy should ideally be examined across different environments, such as:
- Bull markets
- Bear markets
- Sideways markets
- High-volatility periods
- Low-volatility periods
Can Backtesting Guarantee Profits?
No.
This is one of the most important points to understand.
A backtest represents a historical simulation. Future markets can behave differently.
A strategy can perform well historically and still lose money in live trading because of:
- Changing market behavior
- Slippage
- Execution delays
- Liquidity changes
- Increased competition
- Unexpected events
- Model assumptions
- Overfitting
Therefore, backtesting should be treated as a research and validation tool, not a guarantee of future performance.
How to Make Backtesting More Realistic
A robust backtest should attempt to model real-world conditions as closely as practical.
Consider including:
- Realistic transaction costs
- Slippage assumptions
- Bid-ask spreads
- Appropriate position sizing
- Liquidity constraints
- Corporate actions where relevant
- Trading restrictions
- Realistic order execution
- Out-of-sample testing
- Walk-forward analysis
The objective is not to make the backtest look impressive. The objective is to discover whether the strategy remains reasonable under realistic assumptions.
Backtesting Tools and Technologies
Many technologies can be used to build and run backtests.
Popular programming environments include:
- Python
- C++
- Java
- JavaScript
- R
Python is particularly popular because it has a large ecosystem for:
- Data analysis
- Numerical computing
- Statistical analysis
- Machine learning
- Strategy development
- Visualization
Traders can also use specialized algorithmic trading and backtesting platforms instead of building everything from scratch.
A Simple Backtesting Workflow
A practical workflow can look like this:
1. Define the trading idea
↓
2. Convert the idea into objective rules
↓
3. Collect quality historical data
↓
4. Build the backtest
↓
5. Include realistic trading costs
↓
6. Analyze performance and risk
↓
7. Test on unseen data
↓
8. Perform robustness checks
↓
9. Paper trade
↓
10. Consider carefully controlled live deployment
This process can reduce the chance of deploying a strategy based solely on attractive historical results.
Final Thoughts
Backtesting is a fundamental part of algorithmic trading because it allows traders and developers to evaluate strategies before risking real capital.
However, a successful backtest should not be confused with a guarantee of future profits.
The most valuable backtests are not necessarily the ones with the highest historical returns. Instead, traders should look for robustness, realistic assumptions, controlled risk, and consistent behavior across different market conditions.
When combined with proper risk management, out-of-sample testing, paper trading, and continuous monitoring, backtesting can become a powerful part of a systematic trading development process.
Frequently Asked Questions
What is backtesting in algorithmic trading?
Backtesting is the process of applying a trading strategy to historical market data to evaluate its hypothetical performance.
Is backtesting accurate?
Backtesting can provide useful insights, but its accuracy depends on data quality, strategy implementation, execution assumptions, and how realistically market conditions are modeled.
Can backtesting predict the future?
No. Backtesting evaluates historical behavior. It cannot guarantee how a strategy will perform in future markets.
What is overfitting in trading?
Overfitting occurs when a strategy is excessively optimized for historical data and performs poorly on new or unseen data.
How long should I backtest a trading strategy?
There is no universal period. The appropriate period depends on the strategy, timeframe, market, and amount of available quality data. The test should ideally include multiple market conditions.
Is paper trading better than backtesting?
They serve different purposes. Backtesting evaluates historical performance, while paper trading helps evaluate how a strategy behaves in a live or near-live environment.
What should I check after backtesting?
Review returns, drawdown, trade count, profit factor, risk-adjusted performance, transaction costs, robustness, and out-of-sample results before considering further testing.